Chapter 7: Probability
Life's a Game, Let's Find the Odds 🎲
Introduction
1. Introduction
Ever wondered about the chances of your favorite artist dropping a surprise album? Or the probability of snagging that legendary skin in your next game loot box? That's probability in action! It's not just some abstract math concept; it's the logic behind everything from your Spotify shuffle to predicting if your crush will snap you back.
In this chapter, we're going to decode the math of chance. We'll start with the basics of single events (like rolling a dice for a game). Then, we'll level up to see what happens when events are combined, using Tree Diagrams to map out sequences of events, like picking two different snacks from the cupboard. We'll also use Venn Diagrams to sort out overlapping situations, like figuring out how many of your friends are on both Insta and Snapchat. Finally, we'll tackle the boss level: Conditional Probability, which is all about how one event can change the odds for another. Let's get started and turn uncertainty into something you can actually calculate!
In this chapter, we're going to decode the math of chance. We'll start with the basics of single events (like rolling a dice for a game). Then, we'll level up to see what happens when events are combined, using Tree Diagrams to map out sequences of events, like picking two different snacks from the cupboard. We'll also use Venn Diagrams to sort out overlapping situations, like figuring out how many of your friends are on both Insta and Snapchat. Finally, we'll tackle the boss level: Conditional Probability, which is all about how one event can change the odds for another. Let's get started and turn uncertainty into something you can actually calculate!
2. Introduction to Single Event Probability
Alright, let's talk probability. It sounds complicated, but honestly, you use it all the time. It’s the math behind figuring out the chance of getting a rare skin in a loot box, your favourite song playing next on shuffle, or whether you’ll actually get a reply on Snapchat. Probability is just a way to measure how likely something is to happen on a scale from 0 to 1.
Think of it like this: 0 means it’s impossible (like your parents understanding why you need the latest gaming console). 1 means it’s certain (like getting an ad on YouTube). A 0.5, or , is an even chance, like flipping a coin and getting heads. Most things in life are somewhere in between.
Think of it like this: 0 means it’s impossible (like your parents understanding why you need the latest gaming console). 1 means it’s certain (like getting an ad on YouTube). A 0.5, or , is an even chance, like flipping a coin and getting heads. Most things in life are somewhere in between.
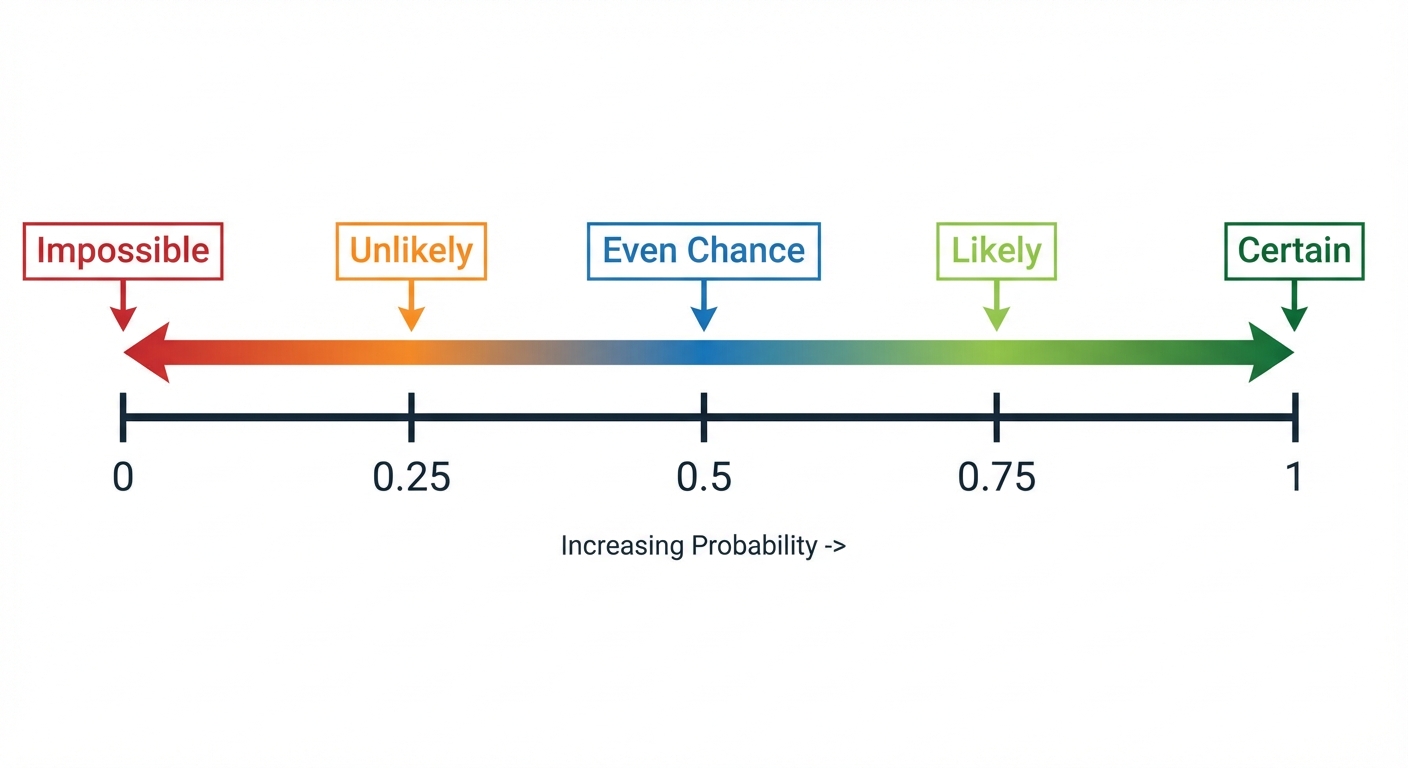
The basic formula is your new best friend: We use the notation to mean 'the probability of event A happening'. For example, the probability of rolling a 4 on a standard six-sided die is .
Now, for a cool shortcut. What about the probability of an event not happening? We write this as , which we call 'the complement of A'. Instead of counting every single other option, you can just do: So, the probability of not rolling a 4 is . It’s way faster! Think of it as the probability you don't have to work your weekend shift at your part-time job. Easy, right? You can give your answer as a fraction, decimal, or percentage – they're all good.
Worked example
Worked Example: Calculating Probability from a Table
Let's Crack This Playlist Problem 🎧
You're putting your music library on shuffle for a road trip. The genres in your playlist are shown in the table below.
| Genre | Number of Songs |
|---|---|
| Pop | 60 |
| Hip-Hop | 45 |
| Indie | 35 |
| K-Pop | 10 |
A song is chosen at random.
a) Find the probability that it is a Hip-Hop song.
b) Find the probability that it is not a Hip-Hop song.
| Genre | Number of Songs |
|---|---|
| Pop | 60 |
| Hip-Hop | 45 |
| Indie | 35 |
| K-Pop | 10 |
A song is chosen at random.
a) Find the probability that it is a Hip-Hop song.
b) Find the probability that it is not a Hip-Hop song.
- 1First up, we need to find the total number of possible outcomes. This is just the total number of songs in the entire playlist. This will be the denominator of our probability fraction.
- 2Now, for part (a), let's find the probability of picking a Hip-Hop song. We use the formula: . The number of 'favourable outcomes' is the number of Hip-Hop songs.
- 3The question doesn't ask for it, but it's always good practice to simplify your fraction. We can divide both the numerator and the denominator by their greatest common divisor, which is 15.
- 4For part (b), we need the probability of the song not being Hip-Hop. We can use the complement rule, , which is much faster than adding up all the other genres.
- 5Finally, we complete the subtraction. Remember that can be written as to make the subtraction easy. This gives us our final answer for part (b).
Answer
3. Combined Events: Using Tree Diagrams
Alright, let's talk about tree diagrams. Think of them like the branching storylines in a game like The Witcher or Detroit: Become Human. Every choice you make opens up new paths, and each path has a certain chance of happening. That's exactly what a tree diagram does for probability – it helps you visualize and calculate the chances of a sequence of events.
First, you start with your initial event – let's say, picking a song from a shuffled playlist. You draw branches for each possible outcome (e.g., picking a rap song or a pop song). On each branch, you write the probability. Super important: the probabilities branching from a single point must always add up to 1. Why? Because it's 100% certain that one of those outcomes will happen.
Now for the second event, like picking another song. You draw new branches coming off the end of your first ones. This is where it gets interesting. If the events are independent (like if you can pick the same song twice), the probabilities for the second set of branches are the same as the first. But if they're dependent – the classic 'without replacement' scenario – things change. Imagine you're grabbing snacks from a bag for you and a friend. Once you take one, it's gone! This means there's one less item in the bag, so the total number of outcomes changes, affecting the probabilities for the second pick.
First, you start with your initial event – let's say, picking a song from a shuffled playlist. You draw branches for each possible outcome (e.g., picking a rap song or a pop song). On each branch, you write the probability. Super important: the probabilities branching from a single point must always add up to 1. Why? Because it's 100% certain that one of those outcomes will happen.
Now for the second event, like picking another song. You draw new branches coming off the end of your first ones. This is where it gets interesting. If the events are independent (like if you can pick the same song twice), the probabilities for the second set of branches are the same as the first. But if they're dependent – the classic 'without replacement' scenario – things change. Imagine you're grabbing snacks from a bag for you and a friend. Once you take one, it's gone! This means there's one less item in the bag, so the total number of outcomes changes, affecting the probabilities for the second pick.
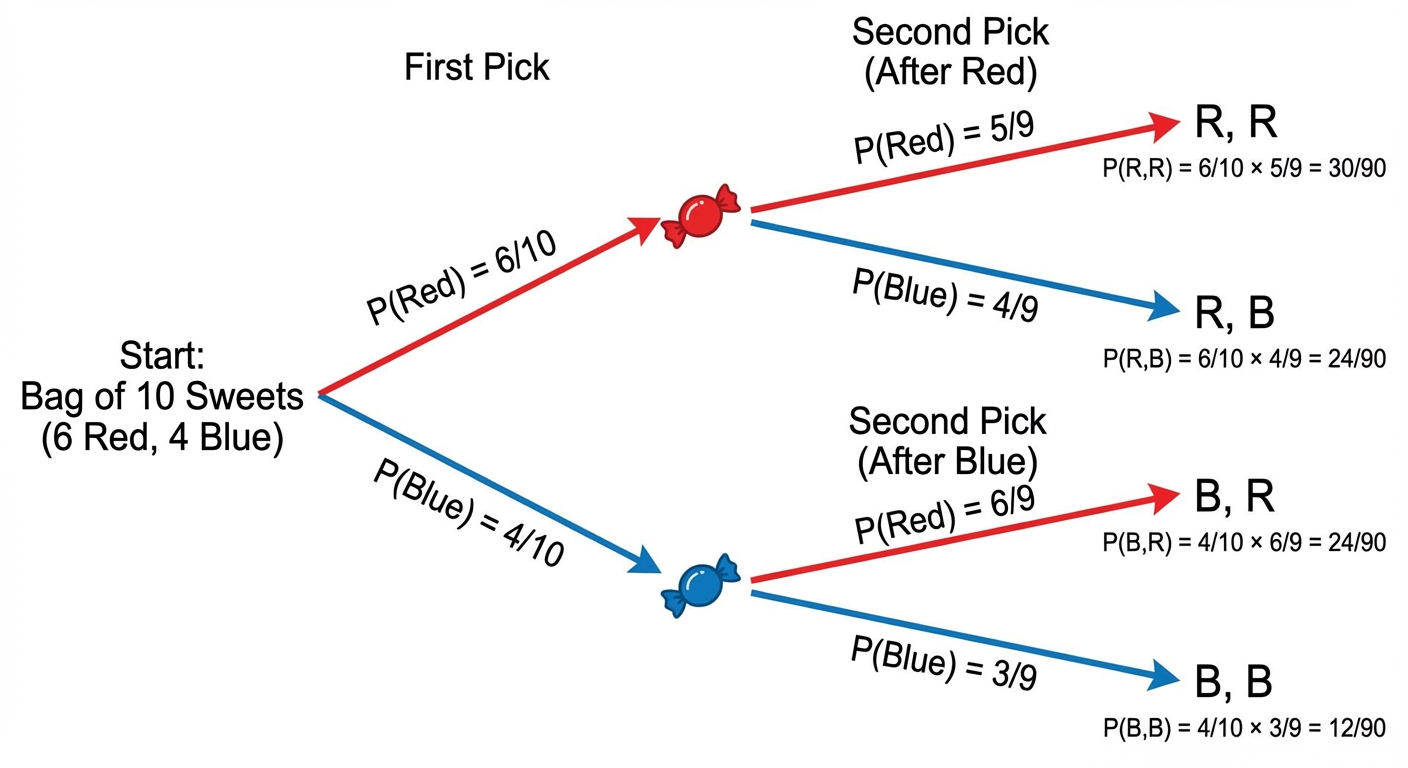
To find the probability of a specific sequence, you use the 'AND' rule: multiply along the branches. So, P(Pop song AND THEN a Rap song) = P(Pop) P(Rap). To find the probability of a more general result, like 'getting one pop and one rap song' (which could be Pop-then-Rap OR Rap-then-Pop), you use the 'OR' rule: find the probability for each successful path and then add them together. It's your secret weapon for acing those tricky combined event questions. 😎
Worked example
Worked Example: Dependent Events without Replacement
The Grab Bag Problem 🛍️
A bag contains 7 green counters and 4 blue counters. You pick one counter at random, do not replace it, and then pick a second counter.
(a) What is the probability that you pick two green counters?
(b) What is the probability that you pick counters of different colours?
(a) What is the probability that you pick two green counters?
(b) What is the probability that you pick counters of different colours?
- 1First, let's set up the tree diagram. We start with 11 counters in total (7 Green, 4 Blue). The first branches will show the probabilities for the first pick.
- 2Now, let's figure out the probabilities for the second pick. These are dependent events because we don't replace the first counter. After one is picked, there are only 10 counters left. If we picked a green first, there are now 6 greens left. If we picked a blue first, there are still 7 greens left.
- 3For part (a), we need the probability of picking two green counters (Green and then Green). We use the 'AND' rule, which means we multiply the probabilities along the G-G branch.
- 4For part (b), 'counters of different colours' means we could either pick Green then Blue (G-B) OR Blue then Green (B-G). We need to calculate the probability for each of these paths by multiplying along the branches.
- 5Finally, since either of these outcomes satisfies the condition, we use the 'OR' rule and add their probabilities together to get the final answer.
Answer
4. Probability of Combined Events using Venn Diagrams
Alright, let's talk about Venn diagrams. You've probably seen these overlapping circles before, but they're clutch in probability for sorting out messy situations. Think of it like trying to figure out your friend group's gaming preferences: some are on PS5, some are on Xbox, and some legends have both. A Venn diagram helps you visualize that.
The whole box represents the universal set, which we label with . This is every single person or outcome we're looking at – like everyone in your year group. The circles inside represent specific events. Let's say Circle A is 'Students who listen to rap' and Circle B is 'Students who listen to pop'.
The whole box represents the universal set, which we label with . This is every single person or outcome we're looking at – like everyone in your year group. The circles inside represent specific events. Let's say Circle A is 'Students who listen to rap' and Circle B is 'Students who listen to pop'.
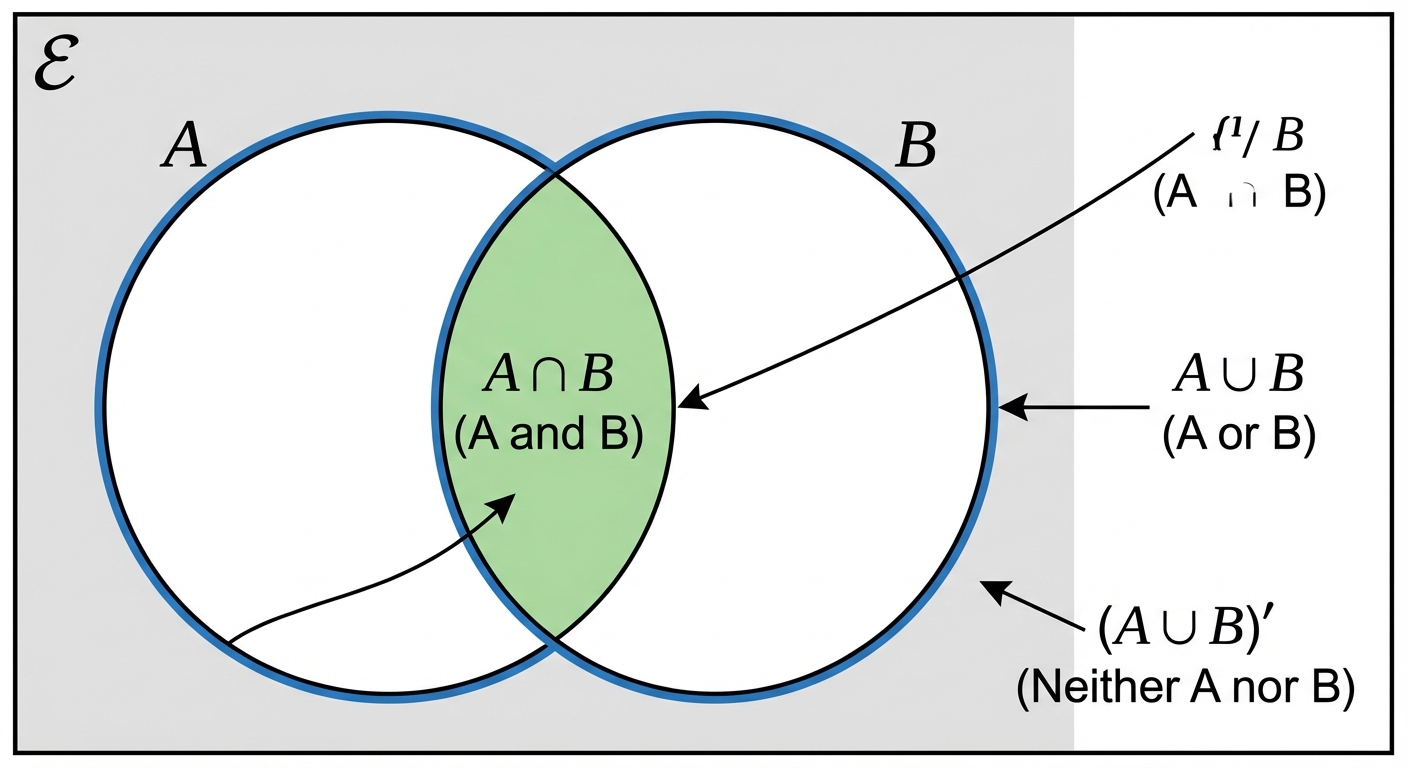
Now for the set notation, which is actually pretty straightforward once you get the hang of it:
• The overlap where the circles cross is called the intersection, written as . This means 'A AND B'. In our example, it's the students with elite taste who have both rap and pop on their playlists.
• Everything inside both circles combined (including the overlap) is the union, written as . This means 'A OR B' (or both). These are all the students who listen to rap, or pop, or both.
• Anything outside a circle is its complement. For example, means 'not in A'. So, would be all the students who don't listen to rap.
When you get a problem, the pro-gamer move is to fill in the intersection () first. Then, you can figure out the 'A only' and 'B only' parts. To find the probability of something, you just take the number of people in the section you care about and divide it by the total number of people in the universal set (). It's basically a visual way to organize the chaos before you calculate anything. Easy dubs. 👍
Worked example
Worked Example: Calculating Probabilities from a Venn Diagram
The Part-Time Job & Driving Hustle 🚗💼
In a survey of 100 students, 45 have a part-time job (J), 32 have their driver's license (D), and 15 have both. A student is chosen at random from the group.
a) Draw a Venn diagram to represent this information.
b) Find the probability that the student has a job or a license.
c) Find the probability that the student has a license but no job.
a) Draw a Venn diagram to represent this information.
b) Find the probability that the student has a job or a license.
c) Find the probability that the student has a license but no job.
- 1First, let's draw and fill in the Venn diagram. The most important rule is to start from the inside out. We begin by putting the 15 students who have both a job and a license in the intersection ().
- 2Now, we find the number of students who only have a job. The entire 'J' circle must add up to 45. Since 15 are already in the overlap, the remaining part is . We do the same for the 'D' circle, which must total 32.
- 3Next, let's figure out how many students have neither. We add up everyone inside the circles and subtract that from the total of 100 students. This number goes outside the circles but inside the box.
- 4For part (b), we need to find the probability of a student having a job or a license, which is . This means they can be in the 'Job only', 'License only', or 'Both' sections. We already calculated the total for this is 62.
- 5Finally, for part (c), we need the probability of having a license but no job. This corresponds to the 'License only' section of the Venn diagram, which we found to be 17.
Answer
5. Conditional Probability
Alright, let's get into Conditional Probability. This sounds super formal, but you use this logic all the time. It’s the 'what if' or 'given that' of the probability world. Think about it: the probability of your favourite streamer going live is one thing, but the probability of them going live given that it's a Friday night is probably way higher! That's conditional probability! It's the chance of an event happening, but with a crucial piece of inside info – we already know something else has occurred.
The absolute key to crushing these questions is to understand that the 'given that' part shrinks your universe. Your total number of possible outcomes (the denominator of your fraction) changes. You're no longer looking at everyone in the survey; you're only looking at, say, the people who have a Snapchat account. We call this 'restricting the sample space'.
We can tackle this using a few familiar tools:
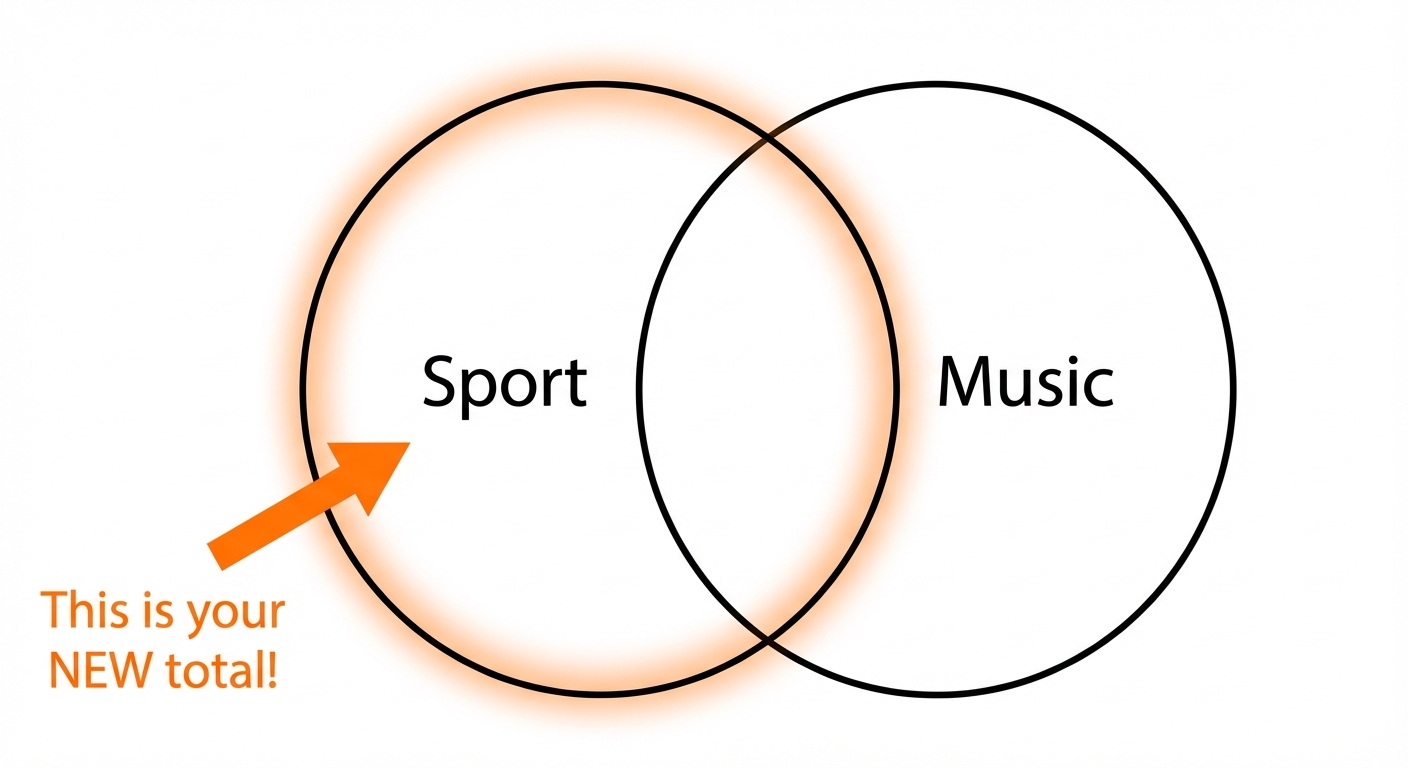
• Venn Diagrams: If the question says, 'Given that a student plays a sport...', you literally ignore everything outside the 'Sport' circle. That circle is your new world. The total number of people in that circle is your new denominator.
The absolute key to crushing these questions is to understand that the 'given that' part shrinks your universe. Your total number of possible outcomes (the denominator of your fraction) changes. You're no longer looking at everyone in the survey; you're only looking at, say, the people who have a Snapchat account. We call this 'restricting the sample space'.
We can tackle this using a few familiar tools:
• Venn Diagrams: If the question says, 'Given that a student plays a sport...', you literally ignore everything outside the 'Sport' circle. That circle is your new world. The total number of people in that circle is your new denominator.
.
• Tables: Super similar! If it's 'Given that a person has a part-time job...', you only look at that specific row or column in the table. The total for that row/column becomes your new denominator.
• Tree Diagrams: Here, the conditional probability is often built right in! The probabilities on the second set of branches are already conditional on what happened in the first branch. For example, the probability of picking a second red sweet is conditional on you having already picked a red sweet first (and not replaced it).
• Tables: Super similar! If it's 'Given that a person has a part-time job...', you only look at that specific row or column in the table. The total for that row/column becomes your new denominator.
• Tree Diagrams: Here, the conditional probability is often built right in! The probabilities on the second set of branches are already conditional on what happened in the first branch. For example, the probability of picking a second red sweet is conditional on you having already picked a red sweet first (and not replaced it).
Worked example
Worked Example: Conditional Probability using a Table
Cracking the Code: Driving Tests & Part-Time Jobs 🚗
A survey of 80 students in Year 11 asked if they had a part-time job and if they had passed their driving theory test. The results are in the table below.
| | Passed Test | Not Passed Test | Total |
|---|---|---|---|
| Has Job | 12 | 28 | 40 |
| No Job | 18 | 22 | 40 |
| Total | 30 | 50 | 80 |
A student is chosen at random. Find the probability that the student has a part-time job, given that they have passed their theory test.
| | Passed Test | Not Passed Test | Total |
|---|---|---|---|
| Has Job | 12 | 28 | 40 |
| No Job | 18 | 22 | 40 |
| Total | 30 | 50 | 80 |
A student is chosen at random. Find the probability that the student has a part-time job, given that they have passed their theory test.
- 1First, spot the condition! The magic words are 'given that they have passed their theory test'. This means we can completely ignore the 'Not Passed Test' column. Our world has just shrunk.Focus only on the 'Passed Test' column.
- 2Now, find the new total for our smaller world. This will be the denominator of our probability fraction. The total number of students who passed the test is at the bottom of that column.New Total (Denominator) = 30
- 3Next, we need the 'successful' outcome. The question asks for the probability the student 'has a part-time job' within our new group. Look in the 'Passed Test' column and find the number that lines up with 'Has Job'.Successful Outcomes (Numerator) = 12
- 4Finally, put it all together to form the probability. It's the number of successful outcomes over our new, restricted total.
- 5Don't forget to simplify your fraction for full marks! Both 12 and 30 are divisible by 6. And that's our final answer. Easy peasy! 👍
Answer
Worked example
Worked Example: Tree Diagram WITHOUT Replacement
A bag has red sweets and blue sweets. Two sweets are taken out one after the other, without replacement. 🍬 Find the probability that both sweets are red.
- 1First sweet: red out of total. That's the easy bit.
- 2Second sweet: now there are only sweets in the bag, and only reds left (one already gone). The denominator changes — that's the 'without replacement' bit.
- 3Multiply along the branches of the tree (AND = ×).
- 4Simplify the fraction.
Answer
Worked example
Worked Example: Conditional Probability from a Two-Way Table
students were asked whether they prefer Spotify or Apple Music, split by gender:
| | Spotify | Apple Music | Total |
| :---: | :---: | :---: | :---: |
| Male | 60 | 40 | 100 |
| Female | 80 | 20 | 100 |
| Total | 140 | 60 | 200 |
Find: (a) . (b) . 🎵
| | Spotify | Apple Music | Total |
| :---: | :---: | :---: | :---: |
| Male | 60 | 40 | 100 |
| Female | 80 | 20 | 100 |
| Total | 140 | 60 | 200 |
Find: (a) . (b) . 🎵
- 1For (a), divide the Spotify total by the grand total.
- 2For (b), conditional probability: 'given Apple Music' means restrict your world to just the Apple Music column. New denominator = .
- 3Simplify.
Answer
Practice this in the app
Unlock the full chapter: practice questions, flashcards, mock papers and notes, free.
Continue revising